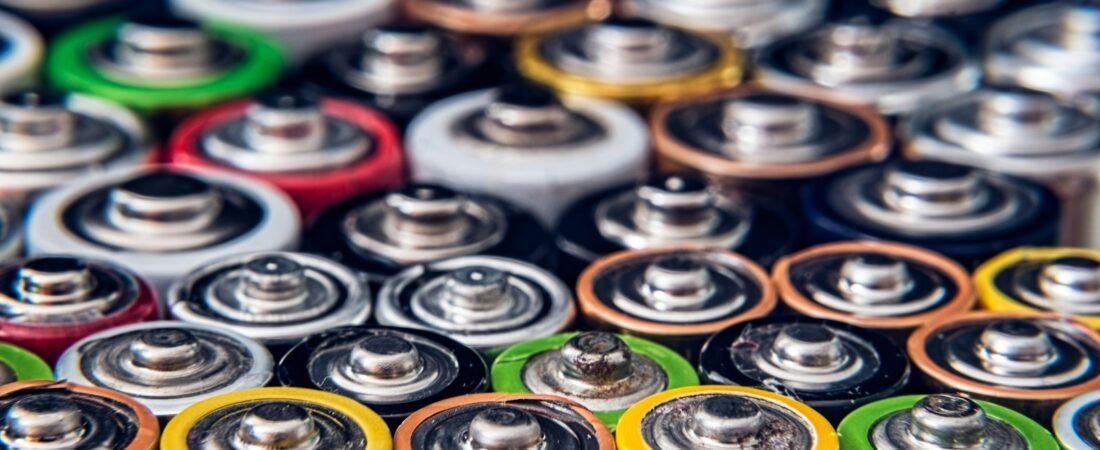
Photo by Roberto Sorin on Unsplash
Here is a claim you will see about Korea’s battery industry, and a second claim, both from credible reporting, both true.
“Korean makers hold about 37 percent of the market.” And: “Korean makers hold about 12 percent of the market.”
Neither is wrong. They are measuring different markets, and the gap between them is most of what you need to understand about the industry’s position.
Claim One: The Market Excludes China
Chinese manufacturers overwhelmingly supply Chinese vehicles, and foreign firms have limited access there. So the industry commonly reports a “global excluding China” figure, which is the market Korean firms can actually sell into.
On that basis, the three Korean makers held 37.5 percent in the first half of 2025, with LG Energy Solution second globally, SK On third and Samsung SDI fifth.
Claim Two: The Market Includes China
Count every battery going into every electric vehicle anywhere and the picture inverts. On that basis the three Korean firms’ combined share was 12.0 percent in January 2026, down from 15.4 percent at the end of the previous year, while the Chinese firms in the top ten moved from 70.4 to 73.3 percent.
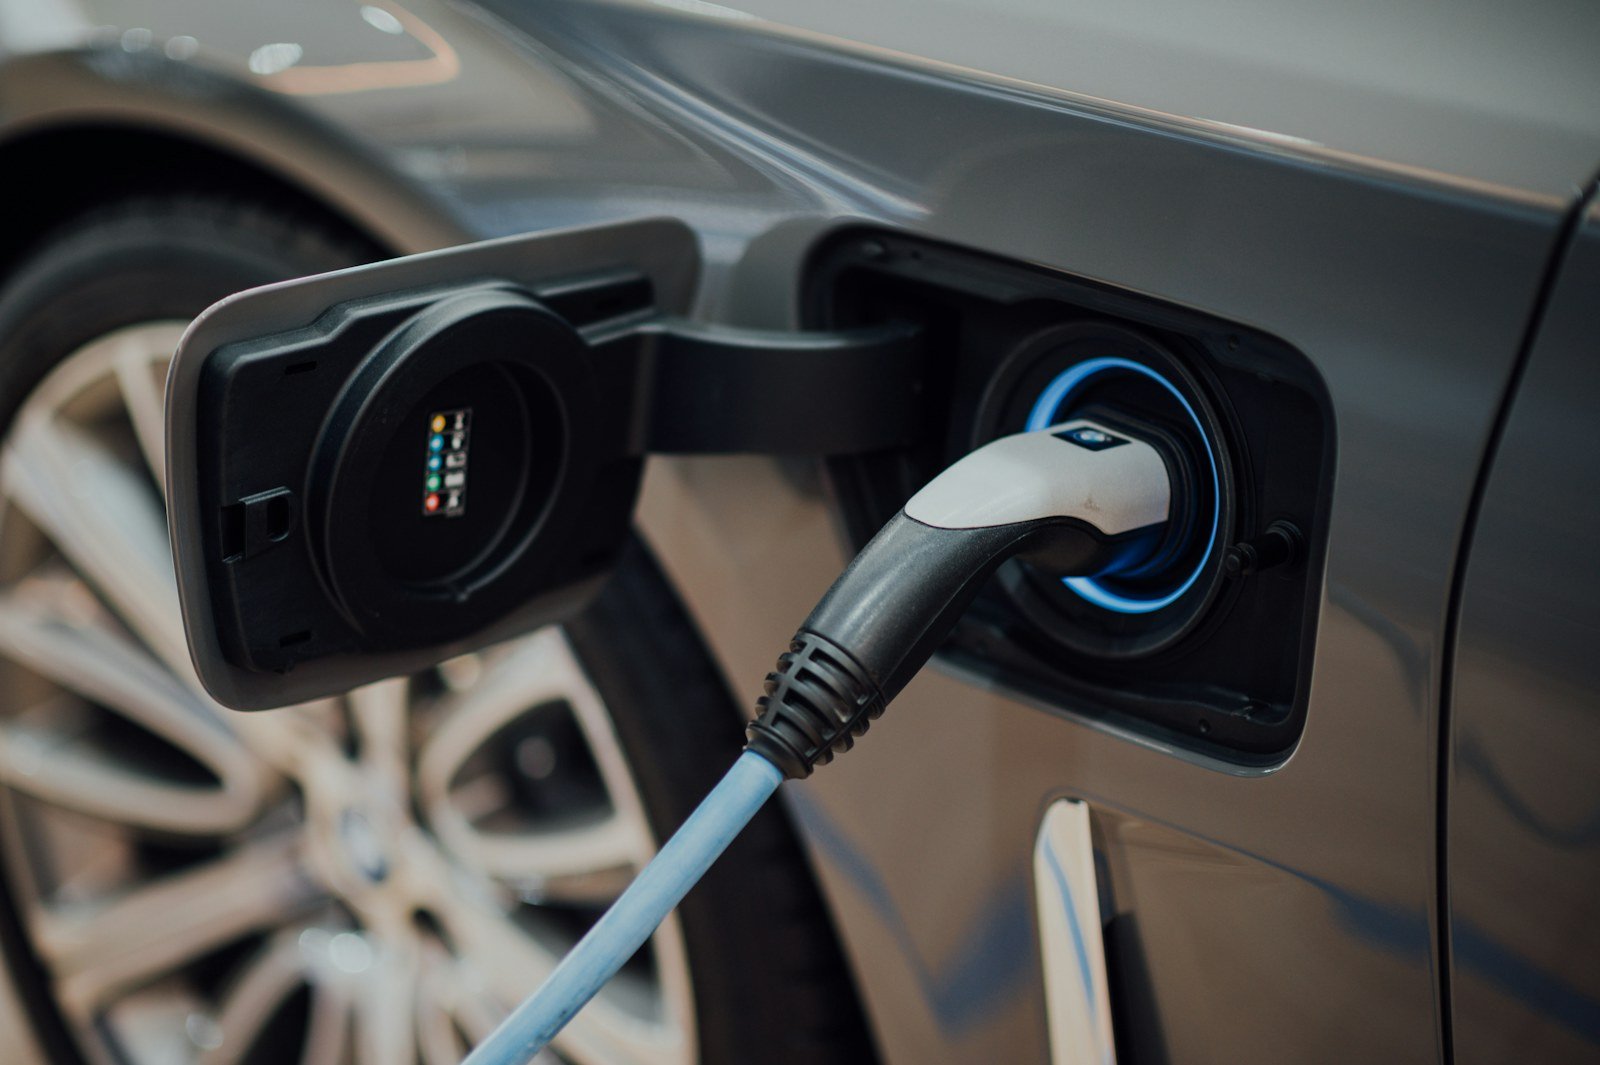
Photo by CHUTTERSNAP on Unsplash
The Number That Cuts Through Both
Market share is contested. Factory utilisation is not, because it measures whether your own plants are running.
| Company | 2025 utilisation | Earlier |
|---|---|---|
| LG Energy Solution | 47.6% | 69.3% in 2023, 57.8% in 2024 |
| SK On | 48.7% | 87.7% in 2023 |
| Samsung SDI | About 50% | European plants materially lower |
Half the capacity, idle. LG Energy Solution’s capacity rose 7.9 percent while its actual production fell more than 11 percent, which is the shape of a company that committed to factories on a demand forecast that did not arrive.
The three posted combined losses of 3.2 trillion won, around $2.2 billion, excluding US production tax credits.
In a market expanding at 24 percent, growing at 2 percent is a retreat conducted at walking pace.
Growing and Losing at the Same Time
The detail that makes this genuinely unusual: in the first half of 2025, demand outside China grew 23.8 percent year on year. LG Energy Solution grew 2.2 percent. SK On grew 10.6 percent. Samsung SDI shrank 7.8 percent.
All three had a defensible year in absolute terms. Two of them grew. And the combined share still fell 8.1 percentage points, because CATL grew 33.2 percent and BYD grew 153 percent over the same period.
Photo by Roberto Sorin on Unsplash
Why It Happened
Two things at once, and the combination is what hurt.
Demand arrived slower than the factories. Capacity was committed years ahead on forecasts of steep EV adoption. Adoption slowed. The plants opened anyway, because you cannot pause a half-built factory cheaply, and utilisation collapsed by arithmetic rather than by failure.
The cheaper chemistry won more of the market than expected. Chinese producers built scale in lower-cost cell chemistry aimed at mass-market vehicles, which is where volume growth actually happened, while Korean makers were positioned toward higher-performance cells for premium models.
What Would Signal a Turn
- Utilisation rising above 60 percent. The most honest single indicator, and harder to present favourably than share.
- Design wins in mass-market vehicles rather than premium ones, which is where the volume is.
- Profitability without production tax credits. Subsidy-dependent profit is a policy position, not a business result.
- Non-automotive demand such as grid storage absorbing idle capacity, which is a genuine possibility given AI data-centre power needs.
The Broader Pattern
Korea’s industrial strength is concentrated in a small number of capital-intensive sectors where it competes at the technology frontier. That works spectacularly when it holds the frontier, as it currently does in the memory that AI accelerators need, covered in What Is HBM Memory. It is punishing when a competitor reaches good-enough at lower cost, which is what batteries are demonstrating.
The same concentration shows up in the manufacturing statistics generally, discussed in Korea’s robot density.
FAQ: Frequently Asked Questions
What share of the EV battery market do Korean firms have?
Around 37.5 percent of the market excluding China in H1 2025, or about 12 percent of the global market including China as of January 2026. Both figures are real; they measure different things.
Are Korean battery makers losing money?
The three posted combined losses of about 3.2 trillion won excluding US production tax credits, with factory utilisation near or below 50 percent.
Why is utilisation so low?
Capacity was built against forecasts of faster EV adoption. The plants opened; the demand grew more slowly. LG Energy Solution’s capacity rose while its production fell.
Can they recover?
Possible but not automatic. Watch utilisation rather than revenue, wins in mass-market vehicles rather than premium, and whether profit survives without subsidy.
General information, not investment advice, and I am not a financial professional. Figures cover H1 2025 and full-year 2025 as reported, and market positions change quarterly. Verify against current filings before drawing conclusions about any company.