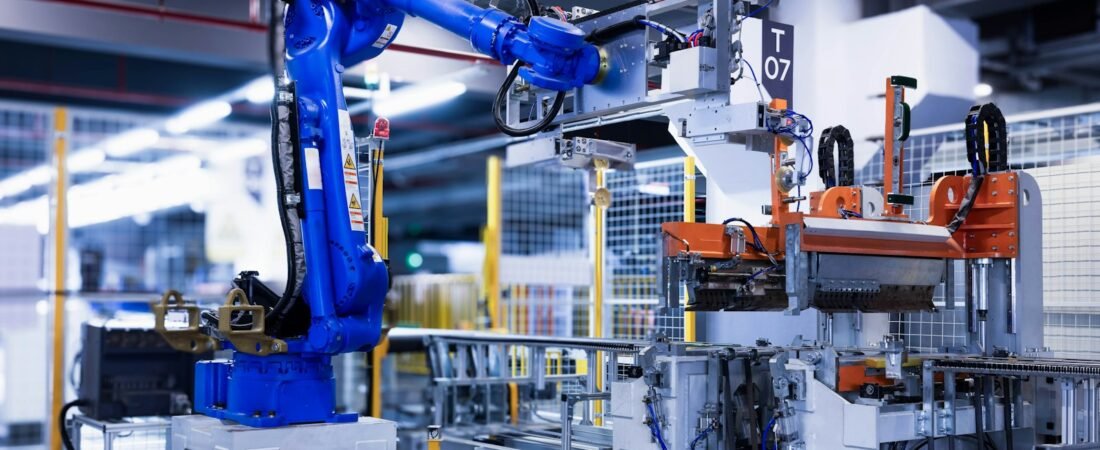
Photo by Homa Appliances on Unsplash
South Korea has 1,220 industrial robots for every 10,000 manufacturing workers. The next country on the list has 818, and the one after that has 449.
That is not a lead. It is a different category. And the interesting part is not that Korea automated hard, which everyone assumes, but what the number is actually measuring, because a ratio can move for reasons that have nothing to do with buying robots.
The Figures
From the International Federation of Robotics, whose World Robotics 2025 report covers 2024 manufacturing data.
| Country | Robots per 10,000 manufacturing employees |
|---|---|
| Republic of Korea | 1,220 |
| Singapore | 818 |
| Germany | 449 |
Korea has grown that figure by roughly 7 percent a year on average since 2019, from a base that was already the highest in the world. Compounding at the top of a ranking is unusual; normally leaders plateau while others catch up.
What the Ratio Actually Measures
Robot density is robots divided by manufacturing employees. Two different events push it up, and they mean opposite things.
| What happens | Effect on the number | What it signals |
|---|---|---|
| More robots installed | Rises | Investment, expanding capacity |
| Manufacturing employment falls | Rises | Contraction, or a shrinking workforce |
| Manufacturing employment grows | Falls | Growth that outpaces automation |
In Korea both numerators and denominators are moving in the direction that lifts the ratio: continued installation, alongside a working-age population that has begun shrinking.
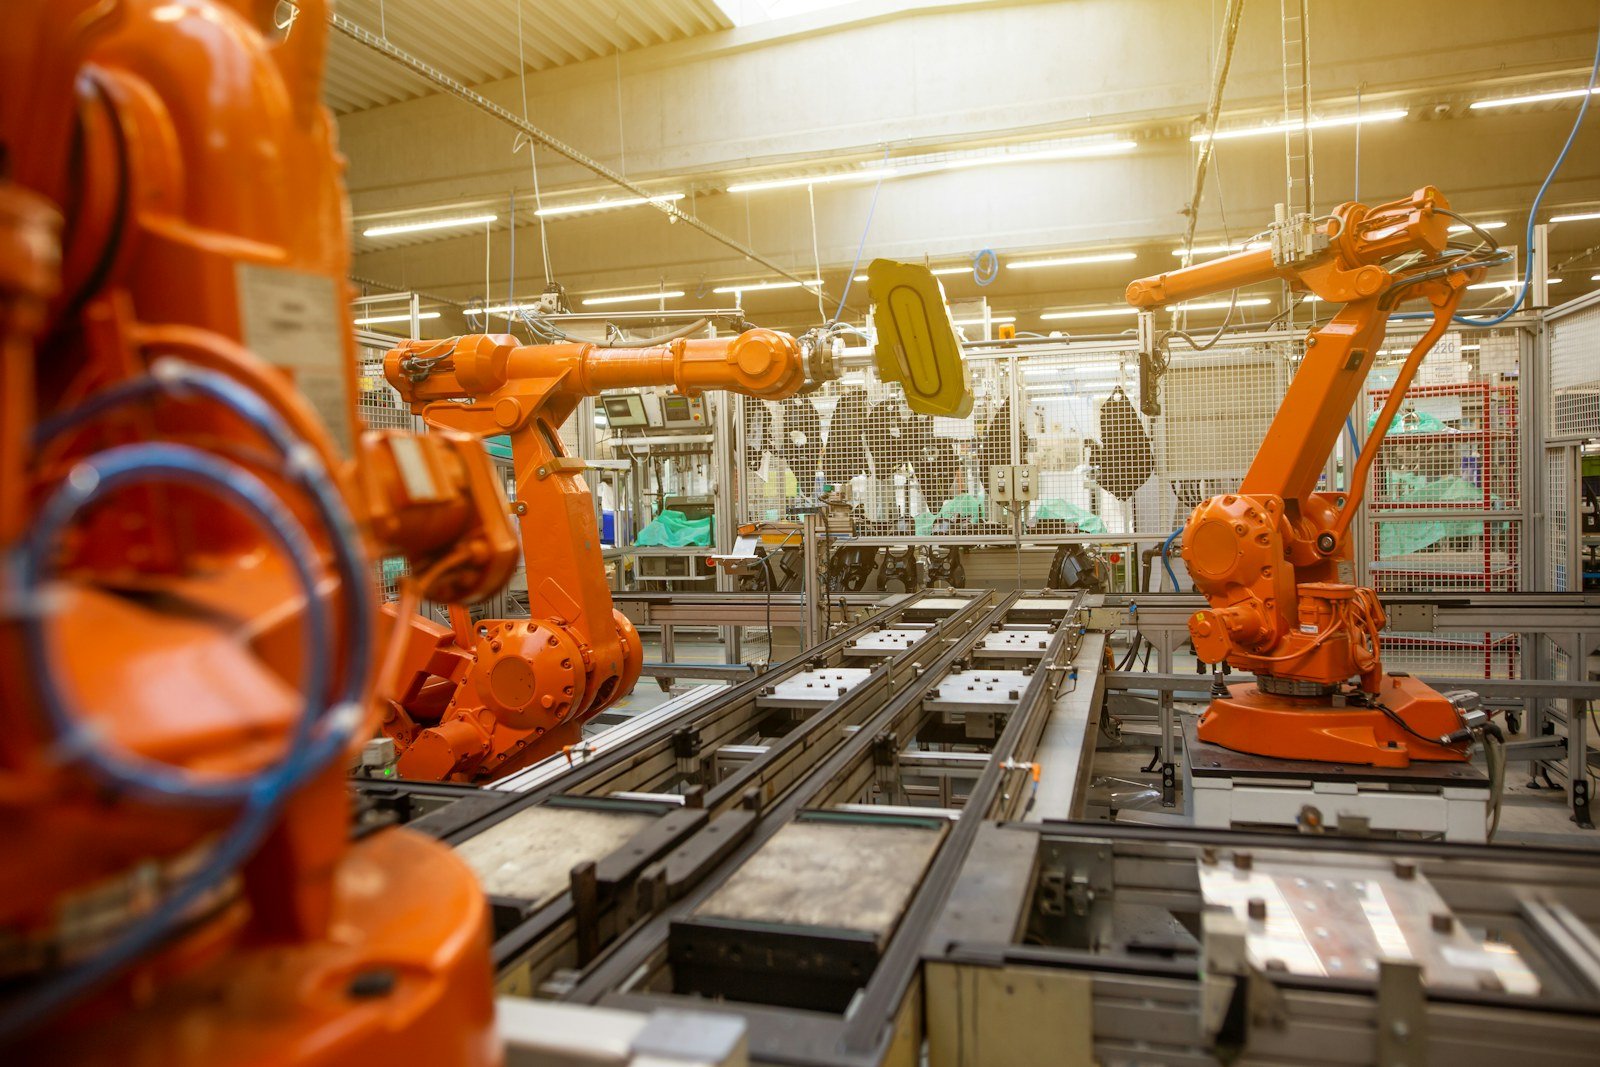
Photo by Simon Kadula on Unsplash
The metric describes a relationship, not effort. Headlines that treat it as a race are misreading the arithmetic.
Two Industries Explain Most of It
Robot density is not spread evenly across an economy. It concentrates wherever production is high-volume, repetitive and precision-critical, which describes exactly two sectors that Korea happens to dominate.
Electronics. Semiconductor and display manufacturing needs placement accuracy no human hand can hold, in environments where human presence is itself a contamination risk. Automation there is not a labour decision; it is a physics one.
Automotive. The traditional heartland of industrial robotics worldwide, and Korea has a large domestic industry.
Concentrate a country’s manufacturing base in those two and the national average lands somewhere no diversified economy will reach. The comparison to Germany, whose manufacturing spans machinery, chemicals and countless mid-sized specialists, is not really like for like.

Photo by Toon Lambrechts on Unsplash
The Demographic Pressure Underneath
Korea’s fertility rate is among the lowest recorded anywhere, and the workforce is contracting. That reframes automation from a cost-cutting exercise into a continuity one: not replacing workers who are there, but covering positions that will not be filled.
It also changes the politics. Automation arguments elsewhere run into displacement objections. Where the shortage is demographic rather than cyclical, that objection has much less force, which is part of why adoption has met little resistance.
What the Number Does Not Tell You
- Nothing about services. This counts industrial robots in manufacturing. Most of any modern economy sits outside that.
- Nothing about how good the robots are. A count treats a decades-old arm and a current one identically.
- Nothing about productivity. Density and output per worker are different measures and do not move together reliably.
- Nothing about job quality. Whether remaining roles became better or merely fewer is not in this data.
Why It Matters Beyond Korea
The same industrial base that produces this ratio is what makes Korea a chokepoint in the AI hardware supply chain, since the memory that AI accelerators depend on is manufactured in exactly these facilities. That connection is covered in What Is HBM Memory.
Read the density figure as a description of an industrial structure rather than a national achievement, and it becomes considerably more informative.
FAQ: Frequently Asked Questions
Which country has the most robots per worker?
South Korea, at 1,220 industrial robots per 10,000 manufacturing employees in the IFR’s 2024 data, ahead of Singapore at 818 and Germany at 449.
Why is Korea’s robot density so high?
Its manufacturing is concentrated in electronics and automotive, the two most automation-intensive sectors, and its manufacturing workforce is shrinking, which lifts the ratio from both directions.
Does high robot density mean fewer jobs?
Not directly. The ratio rises whether robots are added or workers leave, so it cannot distinguish automation from contraction on its own.
Is this measuring all robots?
Only industrial robots in manufacturing. Service robots, logistics automation and anything outside manufacturing are excluded.
Figures are from the IFR World Robotics 2025 report covering 2024 data, as published by the International Federation of Robotics. Definitions and coverage vary between statistical sources; check the IFR release directly before citing.